Japan


Environmental Performance Data
Performance Data
Environmental Management
Environmental impact and initiatives in business activities
Domestic offices of Suzuki Motor Corporation
INPUT
| FY2023 | FY2024 | FY2025 | |
|---|---|---|---|
| Electricity (1 million kWh) |
503.2 | 480.5 | 486.8 |
| Fossil fuel (10,000 GJ) |
163.3 | 153.9 | 147.7 |
OUTPUT
| FY2023 | FY2024 | FY2025 | |
|---|---|---|---|
| CO2 emissions* (1,000 t-CO2) |
306.9 | 78.1 | 79.1 |
Domestic manufacturing plants of Suzuki Motor Corporation
INPUT
| FY2023 | FY2024 | FY2025 | ||
|---|---|---|---|---|
| Electricity and fossil fuel | Purchased power (1 million kWh) | 417 | 393 | 402 |
| Wind power (Kosai Plant) (1 million kWh) | 1.6 | 0.8 | 0.1 | |
| Small-scale water power (1 million kWh) | 0.06 | 0.02 | 0 | |
| Solar power (Iwata, Kosai) (1 million kWh) | 0.9 | 0.8 | 0.8 | |
| LPG (1,000 tons) | 10.9 | 6.7 | 2.1 | |
| City gas (1 million m3) | 23 | 26 | 29 | |
| Kerosene (kL) | 0 | 0 | 0 | |
| Fuel oil A (kL) | 0.3 | 1 | 4 | |
| Light oil (kL) | 7.9 | 7.1 | 7.7 | |
| Gasoline (kL) | 152 | 211 | 209 | |
| Water | Industrial waterworks (1 million m3) | 2.18 | 2.13 | 2.42 |
| Waterworks (1,000 m3) | 40.9 | 37.7 | 37.9 | |
| Well water (1 million m3) | 0.92 | 1.02 | 0.90 | |
| Raw material | Iron (1,000 tons) | 580 | 556 | 529 |
| Aluminum (1,000 tons) | 51 | 45 | 42 | |
| Resin (1,000 tons) | 39 | 38 | 36 | |
| PRTR target substance (tons) | 3,666 | 3,590 | 3,351 | |
OUTPUT
| FY2023 | FY2024 | FY2025 | ||
|---|---|---|---|---|
| Release to atmospheric air | CO2 (1,000 t-CO2) | 129 | 79 | 74 |
| SOx (tons) | 0.05 | 0.03 | 0.08 | |
| NOx (tons) | 51 | 47 | 41 | |
| PRTR target substance (tons) | 1,368 | 1,361 | 1,243 | |
| VOC emissions (tons) | 4,008 | 3,993 | 3,755 | |
| Ozone-depleting substance (CFC-11 conversion) (tons) | 0.001 | 0 | 0 | |
| Discharge | Discharge to rivers, lakes, and reservoirs (10,000 m3) | 602 | 419 | 388 |
| Discharge to sewerage (10,000 m3) | 6 | 5 | 5 | |
| PRTR substance (tons) | 2.6 | 4.2 | 2.5 | |
| Processing | Recycled amount (1,000 tons) | 109 | 118 | 110 |
| Of which are PRTR substance (tons) | 18.2 | 18.5 | 47.3 | |
| Landfill waste amount (tons) | 0 | 0 | 0 | |
- [Scope of aggregation]
Iwata, Kosai, Osuka, Sagara, Hamamatsu plants , and Tooling Plant (PRTR substance includes output at the head office, Motorcycle Technical Center, Marine Technical Center and Shimokawa and Sagara proving grounds and excludes Tooling Dept. Ozone-depleting substances: Suzuki Motor Corporation domestic operations - * Calculated based on emission coefficients under Japan’s Mandatory Greenhouse Gas Accounting and Reporting System (Electricity is based on basic emission coefficients for each electricity provider)
Transportation
INPUT
| FY2023 | FY2024 | FY2025 | |
|---|---|---|---|
| Fuel (light oil, etc.) (10,000 GJ) | 57.4 | 59.5 | 61.4 |
OUTPUT
| FY2023 | FY2024 | FY2025 | |
|---|---|---|---|
| CO2 emissions*(1,000 t-CO2) | 39.5 | 41.1 | 42.4 |
* Calculated based on emission coefficients under Japan’s Mandatory Greenhouse Gas Accounting and Reporting System (Electricity is based on basic emission coefficients for each electricity provider)
Sales and registration
Number of sold/registered vehicles in Japan
| FY2023 | FY2024 | FY2025 | ||
|---|---|---|---|---|
| Automobiles | Automobile sales (1,000 units) | 674 | 718 | 725 |
| Hybrid vehicle sales (1,000 units) | 358 | 406 | 424 | |
| Ratio of hybrid vehicle sales (%) | 53.1 | 56.5 | 58.5 | |
Recycling
Collection of ELVs (automobiles)
| FY2023 | FY2024 | FY2025 | ||
|---|---|---|---|---|
| ASR | Total weight of collection (1,000 tons) | 55 | 51 | 51 |
| Collected vehicles (1,000 units) | 384 | 353 | 346 | |
| Weight of recycled materials (1,000 tons) | 52 | 48 | 48 | |
| Recycling rate (%) | 96.5 | 96.5 | 96.0 | |
| Airbags | Total weight of collection (tons) | 239 | 243 | 270 |
| Collected vehicles (1,000 units) | 366 | 355 | 362 | |
| Weight of recycled materials (tons) | 233 | 236 | 263 | |
| Recycling rate (%) | 97.3 | 97.0 | 97.3 | |
| CFCs | Weight of collection (tons) | 70 | 64 | 63 |
| Collected vehicles (1,000 units) | 373 | 353 | 355 | |
- Recycling rate is calculated on weight basis.
Collection of ELVs (motorcycles)
| FY2023 | FY2024 | FY2025 | |
|---|---|---|---|
| Recycling rate (%) |
97.8 | 97.8 | 97.5 |
- Recycling rate is calculated on weight basis.
Environmental Accounting
Cost of conserving the environment
(hundred million yen)
| Category | Details | Trends | FY2025 | ||||
|---|---|---|---|---|---|---|---|
| FY2023 | FY2024 | Investment | Expenses | Total | |||
| Business area costs | Pollution prevention | Anti-pollution measures such as preventing air and water pollution | 15.0 | 19.2 | 9.0 | 7.0 | 16.0 |
| Global Environmental Conservation | Prevention of global warming, protection of the ozone layer, etc. | 6.9 | 7.9 | 1.3 | 5.4 | 6.7 | |
| Resource Circulation | Effective use of resources, waste reduction, recycling, proper disposal, etc. |
10.7 | 15.4 | 19.3 | 14.8 | 34.1 | |
| Total | 32.6 | 42.5 | 29.6 | 27.2 | 56.7 | ||
| Upstream/downstream costs | Collection, recycling, proper treatment, etc., of ELVs and packaging materials | 0.2 | 0.2 | 0.0 | 0.2 | 0.2 | |
| Administration cost | Employee education, environmental ISO, etc. | 9.8 | 10.9 | 0.0 | 10.9 | 10.9 | |
| Research and development costs | Research and development of products and reduction of their environmental impact, research and development to suppress environmental impact during production, logistics, and sales stages |
840.1 | 982.4 | 153.0 | 930.4 | 1083.4 | |
| Social activities costs | Nature conservation and greening activities, community interaction, donations, information disclosures | 1.1 | 1.1 | 0.0 | 0.7 | 0.7 | |
| Environmental remediation cost | Soil and nature restoration | 0.1 | 0.7 | 0.0 | 0.1 | 0.1 | |
| Total | 884 | 1037.7 | 182.6 | 969.3 | 1151.9 | ||
Effects of conserving the environment
(hundred million yen)
| Target | FY2023 | FY2024 | FY2025 | |
|---|---|---|---|---|
| Economic effect | Energy cost reduction | 2.6 | 6.9 | 2.0 |
| Waste management cost reduction | 0.1 | 0.2 | 0.3 | |
| Resource saving (including recycling and valuable resource disposal) | 57 | 61.8 | 44.3 | |
| Total | 59.7 | 68.9 | 46.6 | |
Climate Change
Disclosure of GHG emissions in the entire value chain, Scopes 1, 2, and 3
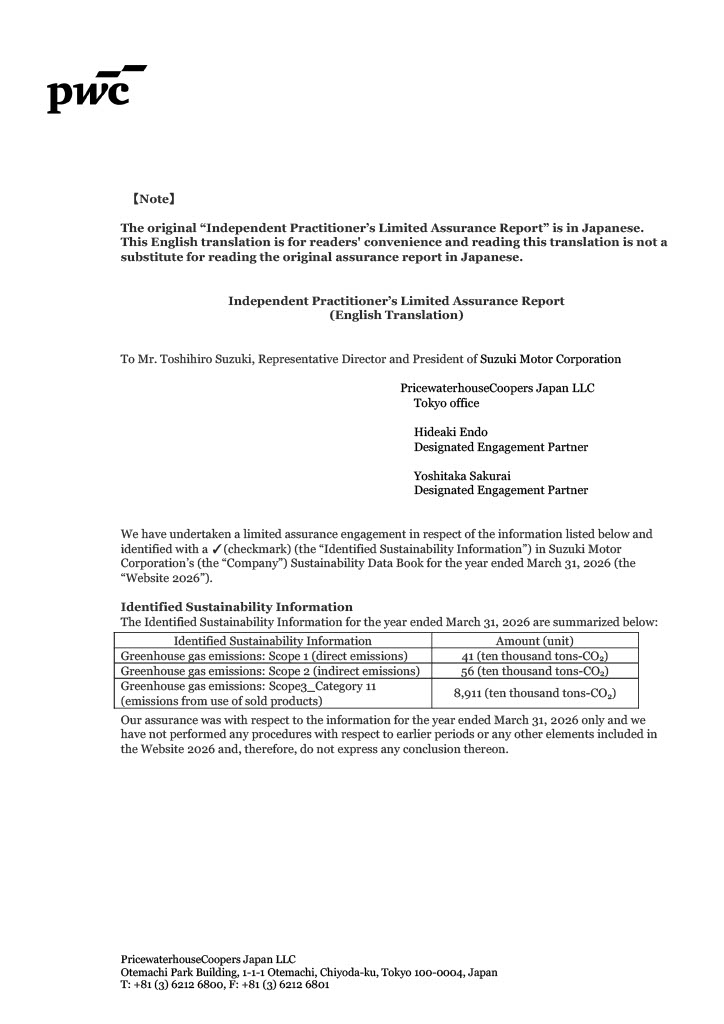
Items marked  have received third-party assurance (10,000 t-CO2)
| FY2022 | FY2023 | FY2024 | FY2025 | ||
|---|---|---|---|---|---|
| Entire value chain (total of Scope 1, 2, and 3) | 10,370 | 10,871 | 11,091 | 11,597 | |
| Direct emissions from corporate activities (Scope 1*1) | 42 | 41 | 41 | 41 | |
| Japan | 15 | 15 | 14 | 13 | |
| Overseas | 27 | 26 | 27 | 29 | |
| Indirect emissions from energies (Scope 2*1) | 72 | 54 | 49 | 56 | |
| Japan | 28 | 11 | 3 | 3 | |
| Overseas | 45 | 43 | 46 | 54 | |
| Emissions from corporate activities (total of Scope 1 and 2) | 114 | 95 | 90 | 98 | |
| Emissions from use of products by users (Scope 3: Category 11)*2 | 8,270 | 8,558 | 8,633 | 8,911 | |
| Other emissions (other than Scope 3: Category 11) | 1,986 | 2,217 | 2,368 | 2,589 | |
| Other indirect emissions (total of Scope 3) | 10,256 | 10,775 | 11,001 | 11,499 | |
[FY2025 Emissions Calculation Parameters and Reporting Standards]
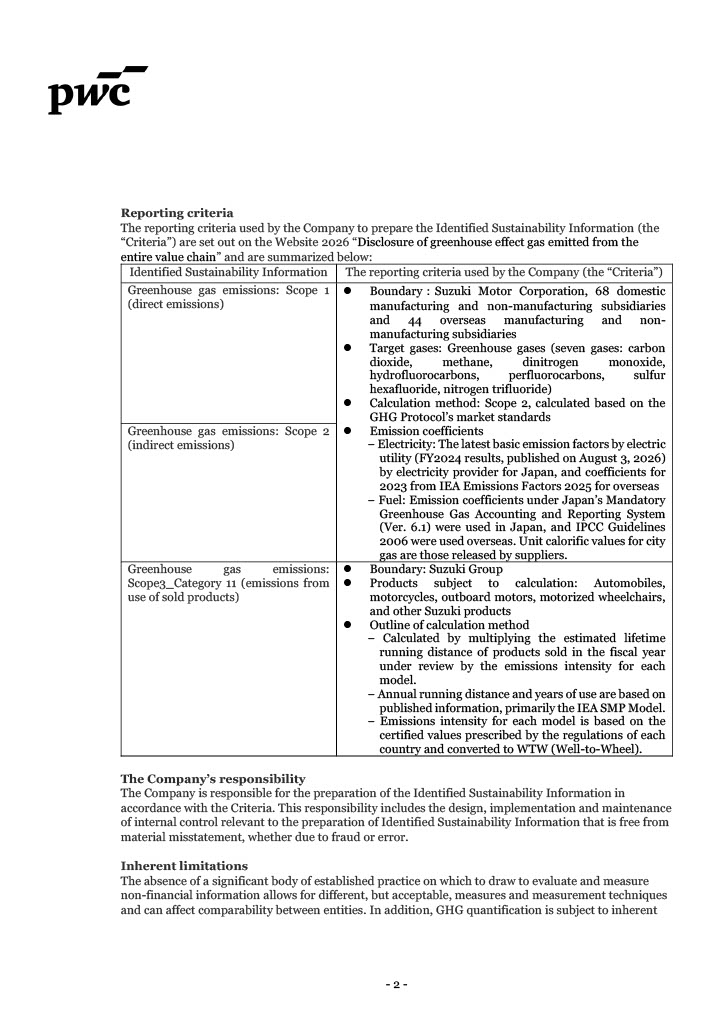
*1 <Scope 1 and 2>
・Boundary:Suzuki Motor Corporation, 68 domestic manufacturing and non-manufacturing subsidiaries and 44 overseas manufacturing and non-manufacturing subsidiaries
・Target gases: Greenhouse gases (seven gases: carbon dioxide, methane, dinitrogen monoxide, hydrofluorocarbons, perfluorocarbons, sulfur hexafluoride, nitrogen trifluoride)
・Calculation method: Scope 2, calculated based on the GHG Protocol’s market standards
・Emission coefficients
− Electricity: The latest basic emission factors by electric utility (FY2024 results, published on August 3, 2026) by electricity provider for Japan, and coefficients for 2023 from IEA Emissions Factors 2025 for overseas
− Fuel: Emission coefficients under Japan’s Mandatory Greenhouse Gas Accounting and Reporting System (Ver. 6.1) were used in Japan, and IPCC Guidelines 2006 were used overseas. Unit calorific values for city gas are those released by suppliers.
*2 <Scope 3 Category 11>
・Boundary: Suzuki Group
・Products subject to calculation: Automobiles, motorcycles, outboard motors, motorized wheelchairs, and other Suzuki products
・Outline of calculation method
− Calculated by multiplying the estimated lifetime running distance of products sold in the fiscal year under review by the emissions intensity for each model.
− Annual running distance and years of use are based on published information, primarily the IEA SMP Model.
− Emissions intensity for each model is based on the certified values prescribed by the regulations of each country and converted to WTW (Well-to-Wheel).
Amount of energy consumed by the Suzuki Group
(GWh)
| FY2023 | FY2024 | FY2025 | |
|---|---|---|---|
| Global total | 3,475 | 3,490 | 3,662 |
| Japan | 1,377 | 1,315 | 1,282 |
| Overseas | 2,098 | 2,175 | 2,380 |
Calculation range: Suzuki Motor Corporation and 68 domestic and 44 overseas manufacturing and non-manufacturing subsidiaries
(includes consumption of renewable energies generated within sites)
Sales of models equipped with hybrid systems (HEV) and CNG*1
(1,000 units)
| By geographic region | FY2023 | FY2024 | FY2025 | |||||||
|---|---|---|---|---|---|---|---|---|---|---|
| Total units | Ratio | Total units | Ratio | Total units | Ratio | |||||
| Number of installed units | Number of installed units | Number of installed units | ||||||||
| HEV | Japan | 674 | 358 | 53.1% | 718 | 406 | 56.5% | 725 | 424 | 58.5% |
| India | 1,794 | 266 | 14.8% | 1,795 | 246 | 13.7% | 1,862 | 229 | 12.3% | |
| Europe | 236 | 214 | 90.7% | 220 | 210 | 95.5% | 187 | 180 | 96.3% | |
| Other | 464 | 41 | 8.8% | 411 | 112 | 27.3% | 444 | 151 | 34.0% | |
| Total | 3,168*2 | 879 | 27.7% | 3,144*2 | 974 | 31.0% | 3,218*2 | 984 | 30.6% | |
| CNG | India | 1,794 | 483 | 26.9% | 1,795 | 620 | 34.5% | 1,862 | 740 | 39.7% |
| HEV+CNG | Total | 3,168*2 | 1,362 | 43.0% | 3,144*2 | 1,594 | 50.7% | 3,218*2 | 1,724 | 53.6% |
*1 Hybrid vehicles only in Japan, Europe, and other regions. Hybrid unit sales in Other regions are units exported from Japan and India. HEVs include Mild Hybrid, S-ENE CHARGE, and SHVS.
*2 The figures for “Total” and “Grand total” are the same because both represent the total number of units sold.
<Automobiles> Trends in reducing global average CO2 emissions of new vehicle sales
(%)
| Target | FY2023 | FY2024 | FY2025 | |
|---|---|---|---|---|
| Trends in reducing global average CO2 emissions of new vehicle sales* (compared with FY2010) | 30 | 28.5 | 30.1 | 31.1 |
- * Global average CO2 emissions of new models are calculated using Company regulations based on CO2 emissions (fuel efficiency) that were measured under the specified method of each country.
<Automobiles> Average CO2 reductions in main markets
(%)
| FY2023 | FY2024 | FY2025 | |
|---|---|---|---|
| Average CO2 reduction in Japan (passenger cars)* (compared to FY2010) | 80 | 79 | 79 |
| Average CO2 reduction in India (compared to FY2010) | 71 | 70 | 69 |
| Average CO2 reduction in Europe (compared to 2010) | 72 | 70 | 67 |
- * Values converted from 10.15 mode or WLTC mode to JC08 mode
<Motorcycles> Trend in the Reduction Rate of Global Average CO2 Emissions from New Motorcycles
(%)
| Target | FY2023 | FY2024 | FY2025 | |
|---|---|---|---|---|
| Trends in reduction rates per unit of global output (compared to FY2010) | 15 | 14 | 15 | 15 |
<Outboard motors> Trend in the Reduction Rate of Global CO2 Emissions per Unit of Output
(%)
| Target | FY2023 | FY2024 | FY2025 | |
|---|---|---|---|---|
| Trends in reduction rates of global CO2 emissions per unit of output (compared to FY2010) | 15 | 20 | 16 | 18 |
Global CO2 emissions performance
(1,000 t-CO2)
| Target | FY2023 | FY2024 | FY2025 | |
|---|---|---|---|---|
| Suzuki | 129 | 79 | 74 | |
| Domestic manufacturing subsidiaries | 47 | 16 | 15 | |
| Overseas manufacturing subsidiaries | 660 | 702 | 783 | |
| Total | 835 | 797 | 872 | |
| Intensity (t-CO2/unit) | FY2025 0.252 |
0.256 | 0.243 | 0.247 |
[Scope of aggregation] Suzuki (Iwata Plant, Kosai Plant, Osuka Plant, Sagara Plant, and Hamamatsu Plant), 5 domestic manufacturing subsidiaries, and 14 overseas manufacturing subsidiaries
CO2 Emission Reductions from Renewable Energy
(t-CO2)
| FY2023 | FY2024 | FY2025 | |
|---|---|---|---|
| Solar power generation Maruti Suzuki India Limited, Pak Suzuki Motor Co., Ltd., etc. | 30,244 | 44,360 | 52,004 |
| Solar power generation Makinohara, Hamamatsu Plant, etc. | 17,700 | 16,922 | 16,952 |
| Total | 47,944 | 61,282 | 68,956 |
CO2 emissions from domestic transportation
| FY2023 | FY2024 | FY2025 | |
|---|---|---|---|
| CO2 emissions (1,000 t-CO2) | 39 | 41 | 42 |
| CO2 emissions per net sales (t-CO2/million yen) | 0.0149 | 0.0154 | 0.0141 |
Air Conservation
SOx and NOx emissions
(tons)
| FY2023 | FY2024 | FY2025 | |
|---|---|---|---|
| SOx emissions* | 0.05 | 0.03 | 0.08 |
| NOx emissions | 51 | 47 | 41 |
*1 SOx emissions are calculated according to fuel consumption from January to December.
[Scope of aggregation] Iwata Plant, Kosai Plant, Osuka Plant, Sagara Plant, and Hamamatsu Plant
VOC emissions from painting processes
| Target | FY2023 | FY2024 | FY2025 | |
|---|---|---|---|---|
| Total VOC emissions (tons) | 4,008 | 3,993 | 3,755 | |
| VOC emissions intensity (g/m2) | 45.3* | 47 | 48.9 | 47.8 |
* Target value for management purposes: 40% reduction compared to FY2000
[Scope of aggregation] Domestic plants with painting processes for automobile bodies, motorcycles, and bumpers (Iwata Plant, Kosai Plant, Sagara Plant, and Hamamatsu Plant)
Water Resources
Global Water Use
| Target | FY2023 | FY2024 | FY2025 | |
|---|---|---|---|---|
| Suzuki (10,000 m3) | 317 | 322 | 338 | |
| Domestic manufacturing subsidiaries (10,000 m3) | 86 | 86 | 82 | |
| Overseas manufacturing subsidiaries (10,000 m3) | 474 | 482 | 483 | |
| Total (10,000 m3) | 877 | 890 | 902 | |
| Water Consumption per Global Automobile Produced (m3/unit) | 2.52* | 2.67 | 2.71 | 2.56 |
- [Scope of aggregation] Suzuki (Iwata Plant, Kosai Plant, Osuka Plant, Sagara Plant, Hamamatsu Plant, and Tooling Plant.), 4 domestic manufacturing subsidiaries, and 14 overseas manufacturing subsidiaries
- *1 Target: 10% reduction compared with FY2016
Global Wastewater Discharge
| FY2023 | FY2024 | FY2025 | |
|---|---|---|---|
| Suzuki (10,000 m3) | 460 | 424 | 394 |
| Domestic manufacturing subsidiaries (10,000 m3) | 88 | 85 | 76 |
| Overseas manufacturing subsidiaries (10,000 m3) | 158 | 155 | 107 |
| Total (10,000 m3) | 705 | 664 | 577 |
| Wastewater Discharge per Global Vehicle Produced (m3/unit) | 2.1 | 2.0 | 1.6 |
[Scope of aggregation] Suzuki (Iwata Plant, Kosai Plant, Osuka Plant, Sagara Plant, Hamamatsu Plant, and Tooling Plant.), 4 domestic manufacturing subsidiaries, and 14 overseas manufacturing subsidiaries
Recycling of Resources
Resource Circulation
(1,000 tons)
| FY2023 | FY2024 | FY2025 | |
|---|---|---|---|
| Iron | 1,326 | 1,340 | 1,255 |
| Aluminum | 181 | 179 | 161 |
| Resin | 101 | 93 | 91 |
| Recycled resin | 0.5 | 0.5 | 0.5 |
[Scope of aggregation] Suzuki, 5 domestic manufacturing subsidiaries, and 15 overseas consolidated subsidiaries
<Automobiles> ASR recycling rate and vehicle recycling rate
(%)
| Standard*1 | FY2023 | FY2024 | FY2025 | |
|---|---|---|---|---|
| ASR recycling rate | 70 or more | 96.5 | 96.5 | 96.0 |
| Vehicle recycling rate (figure converted into percentage of vehicle) | 99.4*2 | 99.4 | 99.3 |
- *1 Legal standard for FY2015
- *2 Vehicle recycling rates prior to FY2023 have been retroactively revised due to a revision of the calculation method.
<Motorcycles> Recycling rate of Suzuki motorcycle products
(%)
| Target* | FY2023 | FY2024 | FY2025 | |
|---|---|---|---|---|
| Recycling rate (percentage of recycling) | 95 or more | 97.8 | 97.8 | 97.5 |
- * FY2015 target
Group total waste generation
(1,000 tons)
| FY2023 | FY2024 | FY2025 | |
|---|---|---|---|
| Suzuki | 131 | 138 | 130 |
| Domestic manufacturing subsidiaries | 20 | 20 | 16 |
| Total | 151 | 158 | 146 |
[Scope of aggregation] Suzuki (Head Office, Iwata Plant, Kosai Plant, Osuka Plant, Sagara Plant, Hamamatsu Plant, and Tooling Plant.), 4 domestic manufacturing subsidiaries
Group landfill waste amount
(tons)
| FY2023 | FY2024 | FY2025 | |
|---|---|---|---|
| Suzuki | 0 | 0 | 0 |
| Domestic manufacturing subsidiaries | 0.04 | 0.04 | 1 |
| Total | 0.04 | 0.04 | 1 |
[Scope of aggregation] Suzuki (Iwata Plant, Kosai Plant, Osuka Plant, Sagara Plant, Hamamatsu Plant, and Tooling Plant.), 4 domestic manufacturing subsidiaries
Chemical Substances
Amount of PRTR target substances that are handled, emitted, and transferred
(tons)
| FY2023 | FY2024 | FY2025 | |
|---|---|---|---|
| Amount Handled | 3,666 | 3,590 | 3,351 |
| Amount Released and Transferred | 1,389 | 1,384 | 1,293 |
[Scope of aggregation] Head office, Iwata Plant, Kosai Plant, Osuka Plant, Sagara Plant (Sagara Proving Grounds), Hamamatsu Plant, Motorcycle Technical Center (Ryuyo Proving Grounds), Marine Technical Center, and Shimokawa Proving Grounds (from FY2020)
Areas Included in the Environmental Initiatives
Suzuki Consolidated Subsidiaries
Domestic manufacturing subsidiaries (5 companies)
Suzuki Auto Parts Mfg. Co., Ltd., Snic Co., Ltd., Suzuki Toyama Auto Parts Mfg. Co., Ltd., Suzuki Akita Auto Parts Mfg. Co., Ltd., and Shinkyo Giken Co., Ltd.
Domestic sales distributors / Domestic non-manufacturing subsidiaries (63 companies)
Suzuki Motor Sales Tokyo Inc., Suzuki Motor Sales Hamamatsu Inc., Suzuki Motor Sales Kinki Inc., Suzuki Motorcycle Sales Inc., Suzuki Marine Co., Ltd., Suzuki Finance Co., Ltd., Suzuki Transportation & Packing Co., Ltd., Suzuki Business Co., Ltd., etc. (63 companies)
Overseas manufacturing subsidiaries (15 companies)
India: Maruti Suzuki India Ltd., Suzuki Motorcycle India Private Limited, TDS Lithium-Ion Battery Gujarat Private Limited, Thailand: Thai Suzuki Motor Co., Ltd., Suzuki Motor (Thailand) Co., Ltd., Indonesia: PT Suzuki Indomobil Motor, USA: Suzuki Manufacturing of America Corp., Hungary: Magyar Suzuki Corporation Ltd., Pakistan: Pak Suzuki Motor Co., Ltd., Philippines: Suzuki Philippines Inc., Myanmar: Suzuki (Myanmar) Motor Co., Ltd., Suzuki Thilawa Motor Co., Ltd., Cambodia: Cambodia Suzuki Motor Co., Ltd., Colombia: Suzuki Motor de Colombia S.A., Vietnam: Vietnam Suzuki Corp.
Overseas sales distributors / Overseas non-manufacturing subsidiaries (29 companies)
USA: Suzuki Motor USA, LLC, Suzuki Marine USA, LLC, Suzuki Motor of America, Inc., Canada: Suzuki Canada Inc., France: Suzuki France S.A.S., Italy: Suzuki Italia S.p.A., Germany: Suzuki Deutschland GmbH, Spain: Suzuki Motor Iberica, S.A.U., Suzuki Madrid S.L.U., Austria: Suzuki Austria Automobil Handels GmbH, UK: Suzuki GB PLC, Poland: Suzuki Motor Poland Ltd., Hungary: Ökröshegy Estate 2004. Kft., Auto Motor Vilag Kft., China: Suzuki Motor (China) Investment Co., Ltd., Shanghai Suzuki Motor Sales Co., Ltd., Taiwan: Tai Ling Motor Co., Ltd., Australia: Suzuki Australia Pty. Ltd., New Zealand: Suzuki New Zealand Ltd., Mexico: Suzuki Servicios de Mexico, S.A. de C.V., Indonesia: PT Suzuki Finance Indonesia, South Africa: Suzuki Auto South Africa (Pty) Ltd., India: Suzuki Digital Private Limited, Suzuki R&D Center India Private Limited, J.J.Impex (Delhi) Ltd., TRUE VALUE SOLUTIONS LTD., Next Bharat Ventures IFSC Private Limited, Next Bharat Venture Fund 1, NBV Community Private Limited
Third-Party Assurance